
The latest Cotality Mapping the Market release highlighted that not only has the steam come out of the Perth property market over recent months but median dwelling values in certain parts of the metropolitan area are starting correct based on Cotality’s House Value change assessment between March and June 2026.
This excellent on-line spatial mapping resource provided freely by UDIA Research Partner Cotality, allows quick metropolitan wide visual assessment of recent movement in house and unit values at the suburb scale over the ‘last three months’ and ‘last 12 months’.
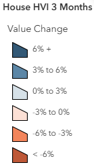
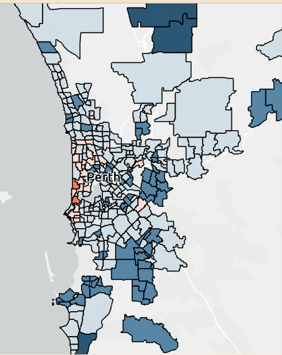
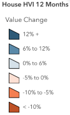
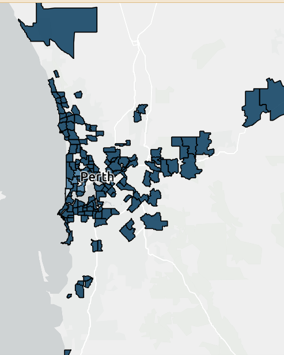
Figure 1 below presents the latest snapshot comparison of detached house value change by suburb across Greater Perth for the June 2026 Quarter, and for the full twelve months from July 2025 to June 2026.
Figure 1: Greater Perth: Cotality House Value Index (HVI) Change by Suburb: Last 3 & 12 Months
Source: Cotality – Mapping the Market (July 2026)
Figure 1 clearly highlights a change in established home market momentum with a total of 26 metropolitan suburbs recording median house value declines over the last three months, while over the course of the last 12 months there was zero suburbs recording value declines. The number of suburbs recording a three month value declines in Perth amounts to 8% of metro suburbs, with most of the price declines peppered across the Central Sub-Region with no growth corridor areas yet to register reversing value growth momentum.
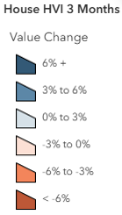
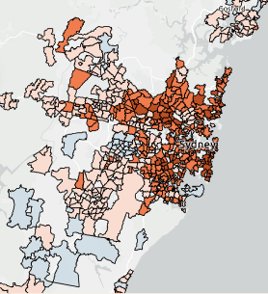
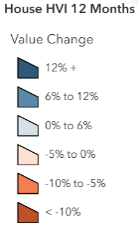
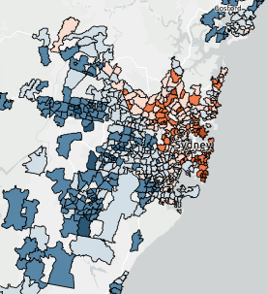
To understand where the Perth market may be heading over the next 12 to 24 months, it might be instructive to consider the Sydney & Melbourne ‘Mapping the Market’ spatial snapshots (Figure 2 & 3) which shows that over the last 3 months 92% of Sydney metropolitan suburbs recorded median value declines with value declines recorded across all inner, middle and outer growth area locations. Across various metrics Sydney’s housing market is in a steeper slow-down mode than yet experienced in Perth, with the initial price declines commencing in the eastern and north shore suburbs late last year, but then value declines becoming increasingly widespread into the start of this year and especially across the June quarter.
Figure 2: Greater Sydney: Cotality House Value Index (HVI) Change by Suburb: Last 3 & 12 Months
Source: Cotality – Mapping the Market (July 2026)
It is a similar story across Greater Melbourne with 89% of suburbs recorded a June quarter decline up from 54% over the 12 month timeframe, with particularly strong declines in the established middle east and south-eastern suburban regions.
Figure 3: Greater Melbourne: Cotality House Value Index (HVI) Change by Suburb: Last 3 & 12 Months
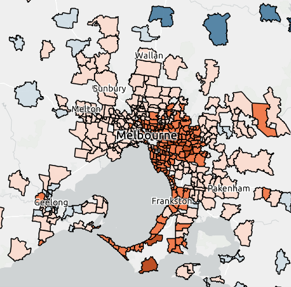
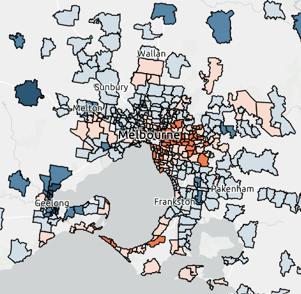
Source: Cotality – Mapping the Market (July 2026)
These latest house value movement maps clearly show house price growth momentum has not only slowed but is trending toward broadscale metropolitan declines. While there are a range of factors influencing the slowing market price growth momentum, one thing is clear from history… declining house and unit prices does not underpin an uplift in supply – which is what the Federal and each State & Territory Government is currently fixated upon.
The softening of value/price growth momentum in pockets of Perth’s established market is also starting to come through another Cotality market measure – the median monthly new house sale price, which recorded a $44,000 drop between March and June 2026 for Greater Perth. Representing a metro wide decline of 3.7% this was the first since the December Quarter 2024 that a quarterly sale price decline has been recorded (which was only -0.5%) for Greater Perth with an average quarterly growth rate for the WA capital of 5% over the last three financial years.
Figure 4 charts the Cotality established and new build median house pricing along with the UDIA WA Urban Development Index (UDI) median lot sale price since March 2020. Over the two years to March Quarter 2026 the UDI median price exploded by 52% to reach $424,025. With the UDIA WA Urban Development Index (UDI) June results due shortly, it will be fascinating to if the price growth slow-down now being recorded in the established market (and now the metro wide new build house sector) also translates into stablisation or even correction in the greenfield land market.
Figure 4: Greater Perth: Established Market & New Build Median House Sale Price and UDI Median Lot Price (Quarterly)
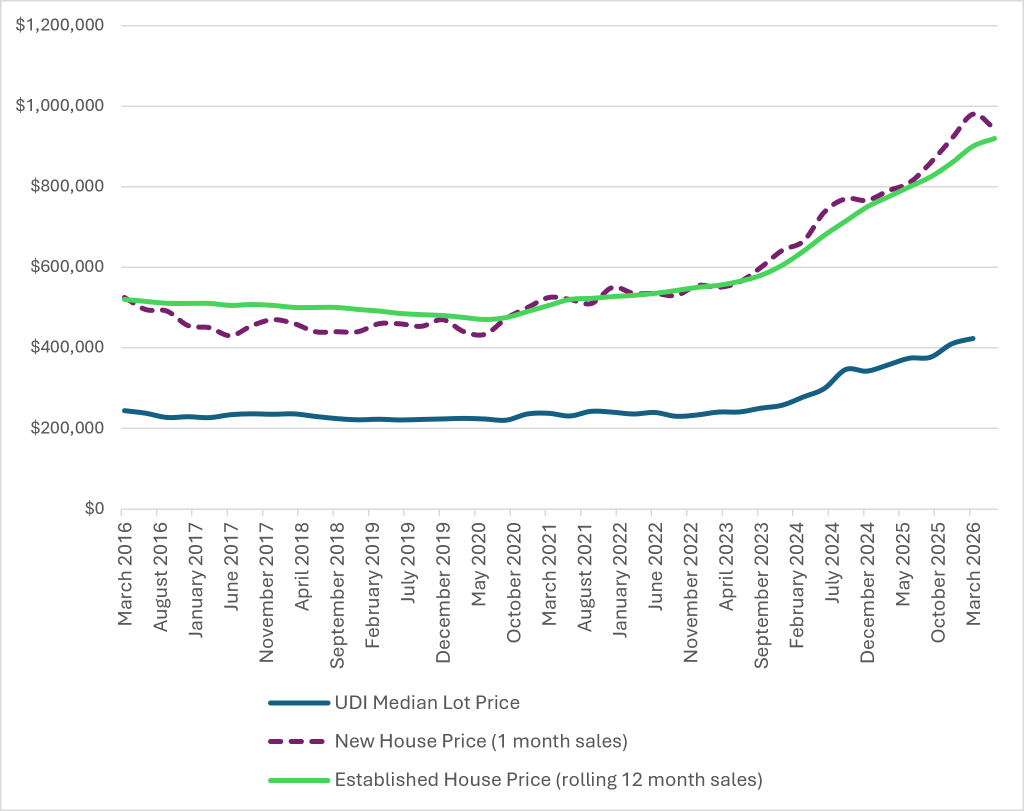
Source: Cotality; UDIA WA (UDI)
This month’s launch of Urban Intelligence marks the first release of our new ‘Chart Pack’ release and the new Urban Intelligence Feature Article publishing on our UDIA WA webpage. These represent on-going upgrades to the manner in which UDIA WA research and insights are published and made accessible to Members.
And a reminder that all of the Urban Intelligence charts and data-points are accessible in our interactive ‘Residential Development Dashboard’ where you Members can modify time series and reporting metrics to suit individual reporting preferences.
As always, the UDIA WA Research Team are always happy to receive feedback or ideas for new property market or economic data points and analysis – so feel free to reach out with your comments!
Warm regards,
Toby Adams, Head of Research (UDIA WA and National)